Conversion Insights Dashboard
The Conversion Insights dashboard shows how your site speed impacts conversion and bounce rates. By default, all metrics represent the past 14 days. To change the date range, click ![]() .
.
To display the Conversion Insights dashboard, in the main navigation, click Dashboard > Conversion Insights. If you have the Conversion Zone feature on the Yottaa's Insights Dashboard, you can also access Conversion Insights by clicking the orange arrow ![]() next to the Conversion Zone Analysis section title to open the Conversion Insights dashboard.
next to the Conversion Zone Analysis section title to open the Conversion Insights dashboard.
Conversion Insights are available only for sites that are tracking conversions. Contact Customer Success to enable this feature.
How Yottaa Tracks Conversions
Yottaa defines a conversion as any time that a customer reaches your order confirmation page.
If you don't see data on the dashboard, confirm the following:
-
An order confirmation page category is defined in Settings > Page Categories. See Page Categories.
-
The Yottaa script is inserted on your order confirmation page. See Confirming that the Yottaa Script Is Running on Your Site's Pages.
Known Bot Filter
You have a choice about which traffic data Yottaa includes in the calculation of your site's conversion rate and other conversion insights displayed on the Conversion Insights dashboard. The Known bots drop-down menu lets you select which traffic data to include.

Select one of the following options to choose which site traffic data Yottaa includes in your conversion insights.
|
Option |
Definition |
|---|---|
|
Known bots excluded |
Excludes data about traffic from known non-malicious bots like Google, Bing, Facebook, Snapchat, Yandex, and others from calculations of your site's conversion rate and other conversion insights. (Default) |
|
Known bots only |
Calculates your site's conversion rate and other conversion insights based solely on the data about traffic by known bots, excluding the data for all shopper traffic. Useful to get an idea of how much of the traffic on your site is non-malicious bot traffic. |
|
All traffic |
Calculates your site's conversion rate and other conversion insights using data for all the traffic on your site. |
|
Example |
Metric |
Definition |
|---|---|---|
|
|
Conversion Rate |
The rate at which your shoppers' sessions |
|
|
Sessions/Conversions |
The first number is total sessions. A session is the period of time in which a customer is active on your site. Yottaa sessions time out after 30 minutes of inactivity. The second number is conversions, or the number of times shoppers' sessions reach the order confirmation page. |
|
|
Target Zone |
The page load time range at which the majority of conversions take place and at which your site's conversion rate is the highest. This number varies across sites. |
|
|
Bounce Rate |
The rate at which sessions |
|
|
Optimized Page Load Time |
The average onload |


Target Zone Analysis
Note that if optimizations are not yet applied, the dashboard displays a simplified version of the Target Zone without the optimized versus unoptimized comparison. You still see a Target Zone as well as the comparison that shows why it’s important to be in the range.
|
Example |
Metric |
Description |
||||||||||||||||||||||||||
|---|---|---|---|---|---|---|---|---|---|---|---|---|---|---|---|---|---|---|---|---|---|---|---|---|---|---|---|---|
|
|
Optimized Sessions in Conversion Zone |
The percent of optimized sessions that fell within the Conversion Zone A session
|
||||||||||||||||||||||||||
|
|
Unoptimized Sessions in Conversion Zone |
The percent of unoptimized sessions that fell within the Conversion Zone during the selected period. |
||||||||||||||||||||||||||
|
|
Yottaa's Impact |
The percent difference between optimized and unoptimized sessions in the Conversion Zone. |
||||||||||||||||||||||||||
|
|
Conversion Zone Comparison |
Compares the following metrics in and out of the target zone:
|
||||||||||||||||||||||||||
|
|
Conversion Zone Analysis Graph |
Use the drop-downs to compare metrics in the graph. The scale for the metric in the right drop-down appears on the right side of the graph. The following options are available: Totals:
Optimization Comparison
Cumulative
|


Performance Impact on Metrics
|
Example |
Metric |
Definition |
|---|---|---|
|
|
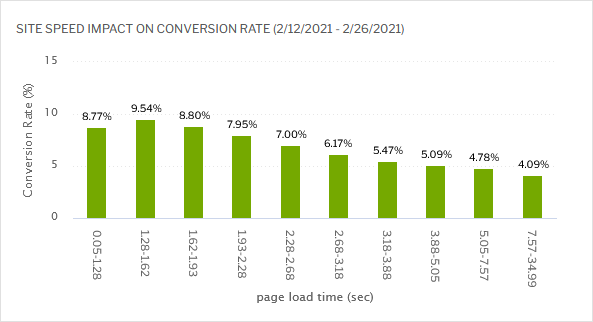
Site Speed Impact on Conversion Rate |
In this graph, each bar represents the conversion rate for sessions that fall within a range of average page load times for the past 14 days. Each bar represents an equal number of sessions. Move the mouse over each bar to see further details. |
|
|
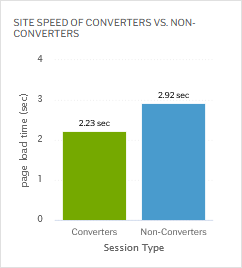
Site Speed of Converters |
Shows the average page load time for sessions that included a conversion and sessions that did not. |
|
|
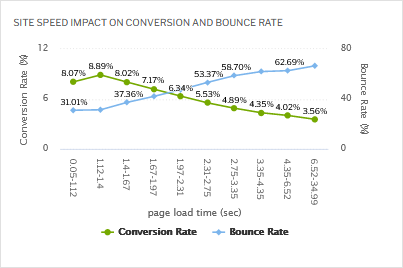
Site Speed Impact On Conversion and Bounce Rates |
Each point on the graph represents sessions within a range of average page load times. Move the mouse over each point to see the conversion and bounce rates for that range. Each time range represents an equal number of sessions. |
Data Trends
|
Example |
Metric |
Definition |
|---|---|---|
|
|
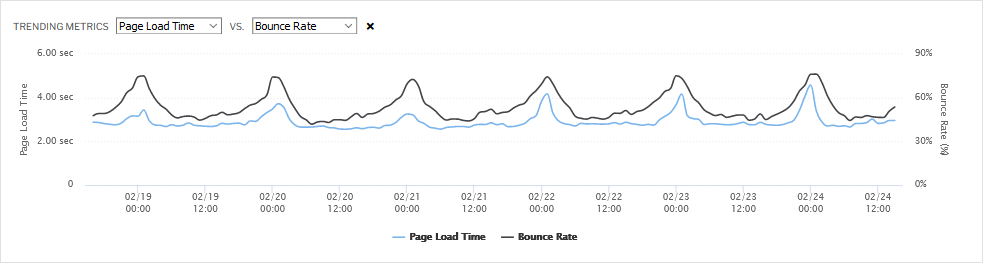
Trending Metrics |
Shows how your site's metrics are changing over time. You can compare page load time, conversion rate, bounce rate, the number of conversions, and the number of sessions. Use the drop-down menus to select metrics and the |
Device Insights
|
Example |
Metric |
Definition |
|---|---|---|
|
|
Sessions by Device |
Shows the total number of sessions broken down by device. Move the mouse over the different sections of the pie chart to see how many sessions occurred on a particular device. |
|
|
Conversions by Device |
Shows the total number of conversions broken down by device. Move the mouse over the different sections of the pie chart to see how many conversions happened on a particular device. |
|
|
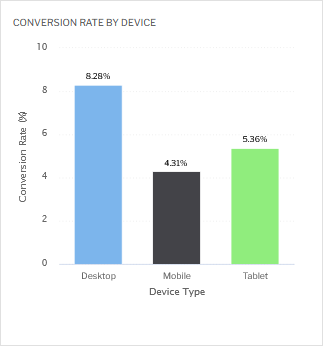
Conversion Rate by Device |
Shows the conversion rate for each device type. |
|
|
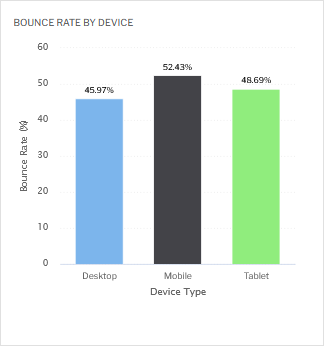
Bounce Rate by Device |
Shows the bounce rate for each device type. |
|
|
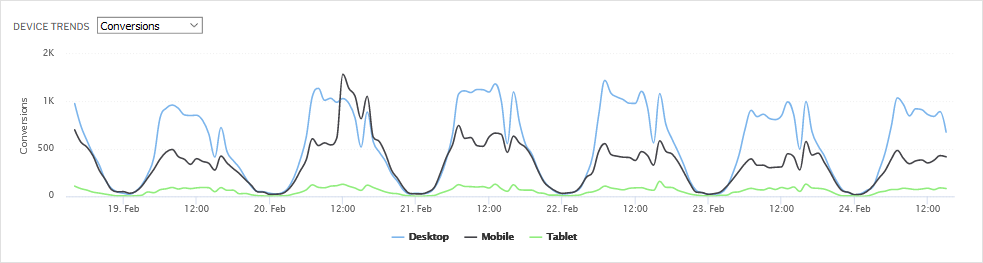
Device Trends |
Shows how the number of sessions, conversion rate, and bounce rate on each device has changed over time. Click |